The Ultimate Guide to Data Analytics & Why It’s Important
88% of IT decision-makers agree that the collection and analysis of data has the potential to fundamentally change the way their company does business over the next 1-3 years, according to Foundry’s 2022 Data & Analytics study.
While data analytics has increasingly been used to improve operational efficiency and customer experience, it can be better used to identify new revenue and business models and drive innovation.
To achieve these goals, 84% of organizations have either already deployed or have data-driven projects on their roadmaps, according to Foundry’s survey. They plan to spend an average of $12.3 million on these data-driven initiatives over the next 12 months.
To help you understand why organizations are investing more budget and time into data-driven initiatives, this guide will explain what data analytics is and why it’s important. It will also cover the different types of data analytics as well as the responsibilities of a data analyst.
What is data analytics?
Data analytics is the process of extracting insights from data to get answers and make predictions. It often has a narrower focus on getting business insights to help an organization make more informed decisions. This is also called business analytics.
Typically, data analysts want to find patterns that indicate trends, risks, or areas of improvement.
This information can help guide core business units, including marketing, sales, information technology, business development, and more. It combines a variety of disciplines, including theory, statistical modeling, data visualization, predictive analytics, and risk management, all in the context of a business environment.
Businesses collect data in a variety of ways, including interviews, surveys, online tracking, and social media monitoring. This results in different types of data. The following types can be analyzed to better inform business decisions:
Big Data
Big data is a concept popularized in the early 2000s. It refers to data that is difficult or impossible to process using traditional methods due to its amount, speed, and complexity — or the three Vs (volume, velocity, and variety). The major benefit of big data is that it provides more information so you can gain more complete answers to questions about your customers and products.
Metadata
Metadata is data about other data. In other words, metadata provides information about other data, such as images, files, web pages, and spreadsheets. Examples of metadata are description and keywords meta tags, which describe content within a web page. Photo metadata often includes the date created, author, and file name of an image file.
Machine Data
Machine data is data that is produced by the activity of computers, mobile phones, embedded systems, and other machines. Machina data can be analyzed to help companies improve the efficiency or accuracy of elevators, manufacturing equipment, weather forecasts, natural disaster warning systems, and more.
Quantitative Data
Quantitative data is structured data that can appear in rows and columns of a database. It can either be counted or compared on a numerical scale, which allows analysts to quantify a problem or answer the “what” or “how many” aspects of a research question. An example of quantitative data is star ratings of a restaurant. This type of data can be gathered using questionnaires, thermometers, or other instruments, and analyzed using statistical analysis software.
Qualitative Data
Qualitative data is unstructured data that can’t fit into rows and columns of a database. Think: text, images, and videos. It describes qualities or characteristics and often appears in narrative form. This type of data can be collected using open-ended questionnaires, interviews, focus groups, or observation.
Data analytics can be confused with data science. While interconnected, these are not the same. Both have different approaches and provide different results. Let’s take a closer look at these two disciplines below.
Data Science vs. Data Analytics
Data science is about using data to make predictions for the future and find the right questions to ask, whereas data analytics is about using data to gain meaningful insights and answer specific questions. While data science primarily uses the techniques of machine learning and predictive modeling to make predictions, data analytics primarily uses statistical analysis of historical data to uncover actionable data.
Below are other key differences.
Data Science
- Goal is to discover new questions that you might not have realized needed answering to drive innovation
- Concerned with asking questions
- Mine large datasets without specific questions in mind
- Explores disparate and disconnected data sources
Data Analytics
- Goal is to uncover actionable insights for current problems to inform better business decision making
- Concerned with answering questions
- Focused on specific areas with specific goals
- Analyzes smaller datasets
Importance of Data Analytics
Data analytics is important because it enables key stakeholders to make decisions based on data, instead of guesswork. It can serve a broad range of purposes, including market trend predictions, risk assessment, and performance improvement. This can lead to more efficient operations, reduced costs, new products and services, and improved customer satisfaction, among other benefits.
For example, an e-commerce company may use demographic and past purchase data to inform its marketing campaigns, including retargeting ads, webinar series, and events. It may also use this data to decide what products and services to create next in order to attract and delight its customers. It can even use data to identify opportunities to streamline its operations via automation or another initiative.
Now that we have a better idea of why data analytics is important, let’s take a look at the different types — all of which may be used in a comprehensive data plan.
Types of Data Analytics
- Descriptive
- Diagnostic
- Predictive
- Prescriptive
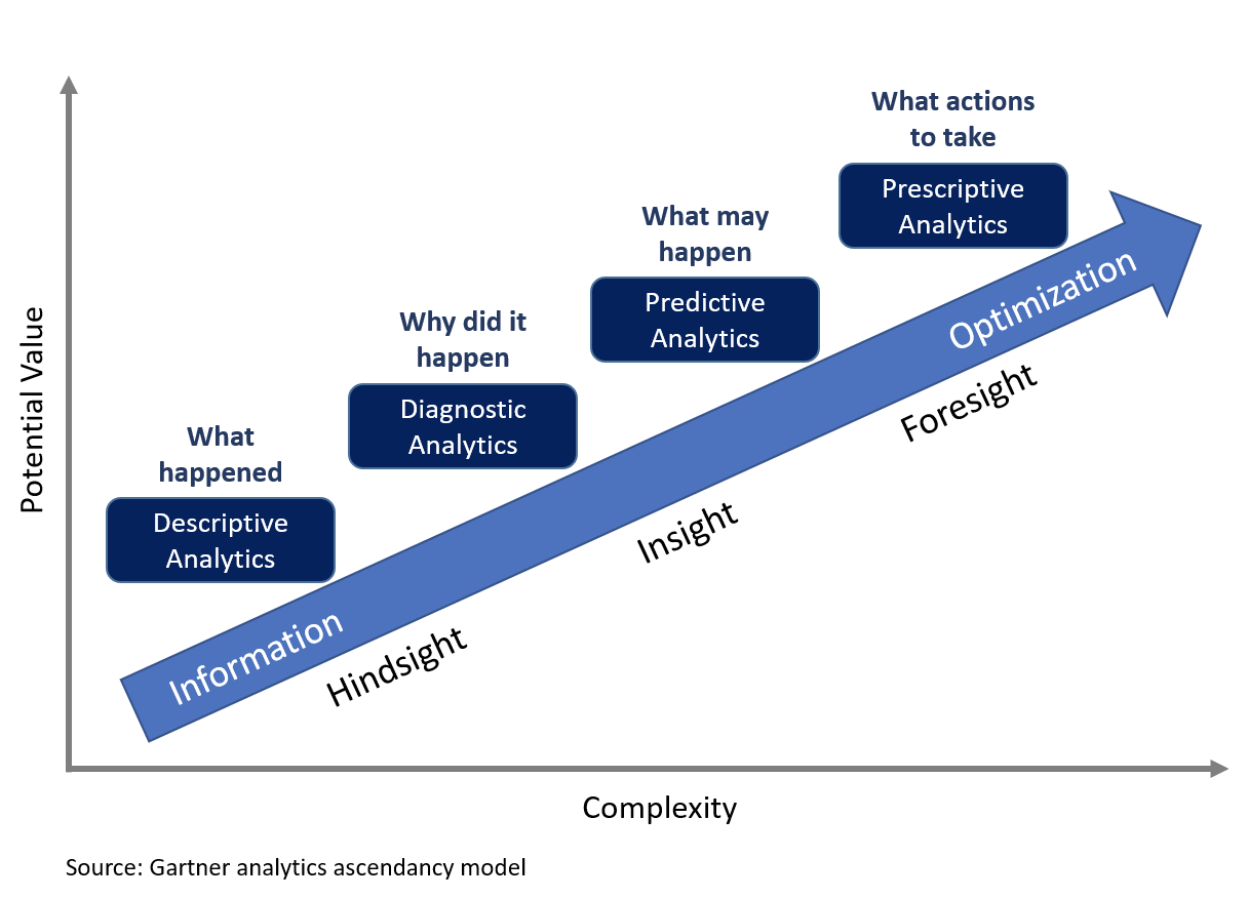
1. Descriptive Analytics
Descriptive analytics aims to answer questions about what happened. Using data collection, processing, analysis, and visualization, descriptive analytics can help summarize large datasets to describe outcomes — including successes and failures — to stakeholders. This type of data analytics provides essential insight into past performance through a combination of ad hoc reporting and canned reports.
Examples of descriptive analytics are monthly revenue, quarterly sales, and yearly website traffic.
2. Diagnostic Analytics
Diagnostic analytics aims to answer questions about why something happened. A supplement to descriptive analytics, diagnostic analytics tries to find the cause of what happened by finding dependencies and patterns in the descriptive data sets. It is meant to diagnose either a drop or an improvement in performance.
For example, diagnostic analytics may uncover that customers are canceling their subscription due to missing functionality in the product. Maybe they want to be able to skip a month, for example, or turn off auto-renew. Insights like these can be used to enhance products, improve the user experience, or reposition brand messaging.
Predictive Analytics
The most common type of data analytics, predictive analytics aims to answer questions about what will happen. It uses statistical modeling, machine learning, and data mining techniques to identify trends in historical data and determine if they are likely to occur in the future. Businesses typically use this type of analytics to reduce risk and identify new opportunities.
For example, a data analyst may use historical data and data from the broader industry to project sales, revenue, and expenses to forecast the future health of the organization.
Prescriptive Analytics
Prescriptive analytics aims to answer questions about what should be done. Using AI, big data, and machine learning techniques to find patterns in large datasets and analyze past decisions and events, prescriptive analytics can help predict outcomes and prescribe a course of action.
Here’s an illustration of the relationship among all these types of data analytics:
Data Analysis Methods
There are several methods you can use to analyze data to get different types of insights. Below we’ll take a look at some of the most common methods.
Time Series Analysis
Time series analysis is the method of analyzing a set of data points over a specified period of time to understand if variables changed during that interval and if they are dependent. This type of analysis can help explain different trends and patterns.
For example, a time series analysis may help you understand the impact of seasonality on your website traffic. Website traffic may drop during major holiday weeks like Christmas and peak during other months like September. These insights can help you set goals and manage your editorial calendar accordingly.
Cluster Analysis
Cluster analysis refers to the method of grouping data into clusters so elements in one cluster are more similar than elements in another cluster. The goal is to discover hidden patterns or provide additional context to a trend.
For example, customers may be grouped into clusters based on demographics or purchasing behavior. Then, they can be targeted with specific marketing campaigns to encourage them to spend more, create an account, or take another action.
Regression Analysis
Regression analysis is an important method of data analysis that uses historical data to understand how the value of a dependent variable is affected by one or more independent variables. By analyzing the relationship among variables in the past, you can predict possible outcomes and make more informed decisions in the future.
For example, an analysis of your annual sales may reveal that product quality, customer service, competitor promotion, and dozens of other variables affect your overall performance. That makes annual sales the dependent variable and the others independent variables. Regression analysis seeks to answer questions like which factors matter the most, how do those factors interact with each other, and which factors can we ignore. By providing an explanation of the relationship between the independent variable and each dependent variable, you can better predict how to impact the dependent variable — whether that’s sales, employee retention, or recruitment.
Statistical Modeling
Statistical modeling refers to the process of applying statistical analysis to a dataset and creating a mathematical representation of observed data. Looking at a mathematical representation of data provides several advantages over sifting through raw data. Analysts and non-analysts alike can more easily visualize the data, identify relationships between variables, and make predictions about future datasets.
Businesses may use statistical modeling for large and complex datasets like census data, public health data, and social media data.
Factor Analysis
Factor analysis is a data analysis method used to uncover a smaller group of factors within a larger set of variables. This enables you to reduce larger datasets into more manageable sets and to discover hidden patterns. The goal of factor analysis is to get insights about concepts that are more difficult to measure and observe, like customer loyalty and satisfaction.
For example, let’s say you have a large dataset of answers to your most recent customer survey. Instead of analyzing every single survey question or response, you can use factor analysis to group questions or responses that are strongly correlated. For example, survey items about household income, monthly budget for shoes, and pairs of shoes owned may all be reduced to the single factor of consumer purchasing power. By reducing hundreds of individual variables to a smaller number of factors in this way, you can more easily analyze these factors to learn more about your customers.
Spatial Analytics
Spatial analytics is a method of data analysis that combines public or private data sets with location data from geographic information systems to help businesses make more informed decisions, particularly about site selection.
This method can help a retail business determine the optimal location for a new storefront, for example.
Sentiment Analysis
Sentiment analysis is a popular method for analyzing qualitative data often via complex machine learning algorithms. The goal of this method is to interpret and classify the emotions conveyed in surveys, social media posts, and other text. Businesses may use this technique to understand how customers feel about their new ad campaign, product, or overall brand.
What is a data analyst?
A data analyst retrieves and reviews data to uncover actionable insights and predictions that can help an organization improve its performance and innovate.
Their responsibilities typically include:
- collecting data using software, surveys, and other tools
- designing and maintaining data systems and databases
- using statistical tools to interpret data sets
- preparing reports that effectively communicate trends, patterns, and predictions based on relevant findings to key stakeholders
At the intersection of information technology, statistics, and business, data analysts must have a variety of skills, including mathematical, statistical, analytical, numerical, and technical skills. They must also be strong decision-makers, problem solvers, and communicators, and be able to work cross-functionally with sales, product, demand generation, and other teams.
Typically, a bachelor’s degree in mathematics, statistics, computer science, engineering, or a similar quantitative analytics discipline is required.
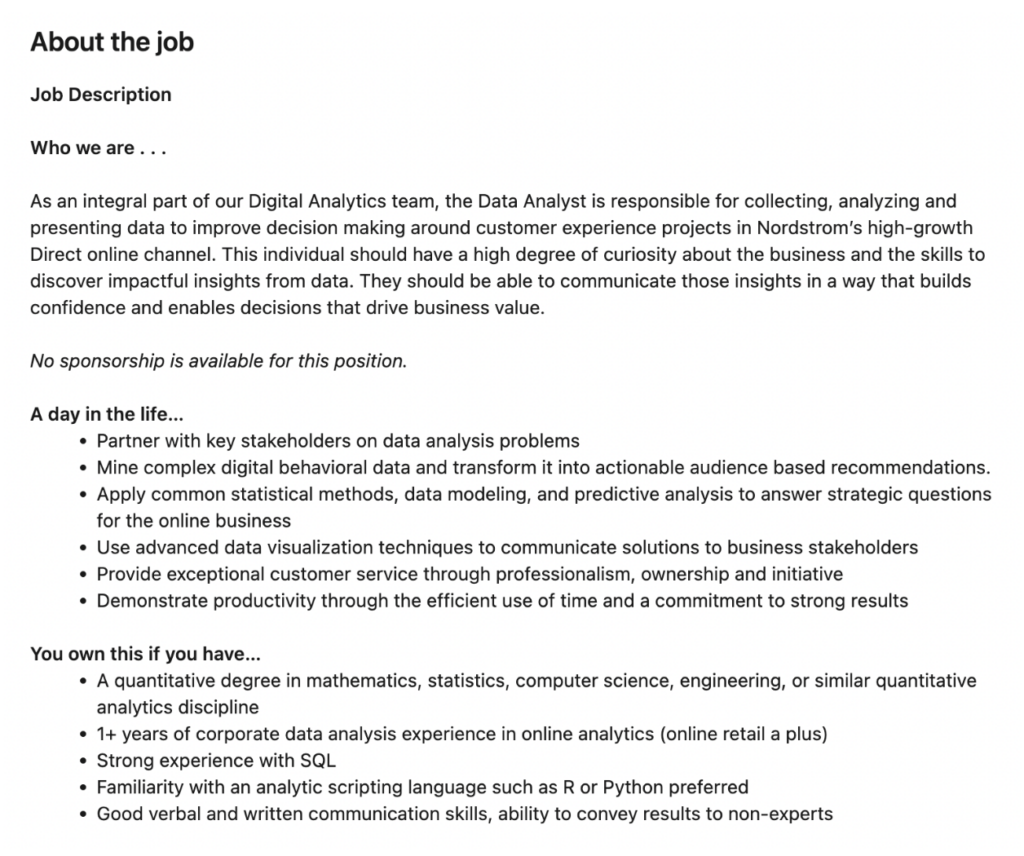
To get a better understanding of what a data analyst does, take a look at this job posting on LinkedIn:
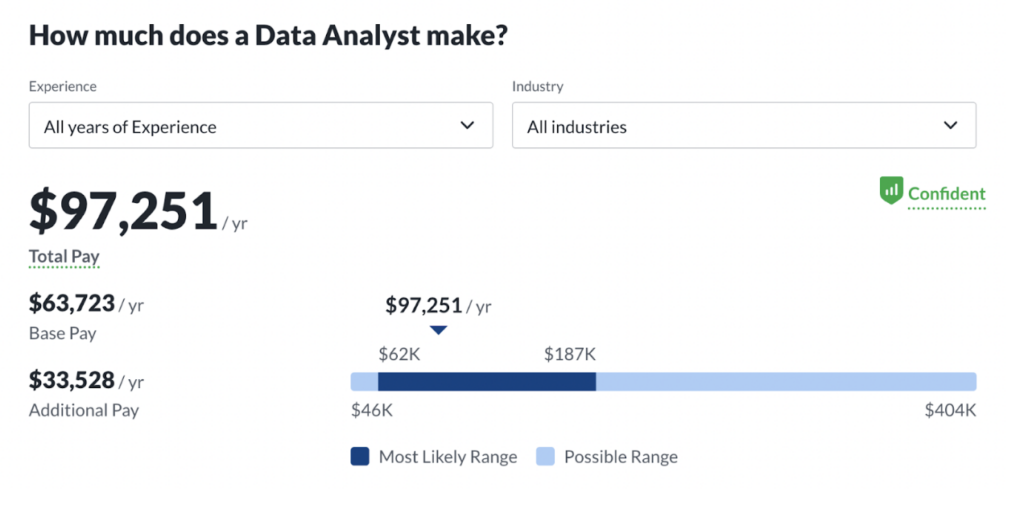
Data Analyst Salary
According to Robert Half Technology’s 2022 Salary Report, data analysts earn between $87,500 and $126,250 on average.
Glassdoor estimates the median salary is $95,792 per year based on salaries collected from its users, with the most likely range from $61,000 to $183,000. Where a data analyst falls in that range depends on their experience, education, skill set, and location, among other factors.
To truly understand the role of a data analyst, you must understand what a data analytics strategy is. Let’s take a look at this term below, then check out the steps for creating one.
Data Analytics Strategy
A data analytics strategy should determine how data is going to be analyzed, by and for whom, and why. This should align with the overall organizational strategy.
With a data analytics strategy that aligns with your overall organizational objectives, you can provide actionable insights to stakeholders, protect the quality and availability of your data, integrate multiple data sources, and take steps to make your company more data-driven. These are just a few benefits that such a strategy provides.
To create a data analytics strategy, complete the following steps:
1. Identify key stakeholders.
To start, identify key stakeholders from different business units who can provide important insights about how data is currently collected and analyzed and what their objectives are. An executive sponsor can also help get buy-in across the organization — and budget if needed.
2. Understand current data analytics processes.
Next, your cross-functional team should assess the current state of your data analytics program. What type of data is being collected? What processes are already in place? Could they be optimized? These are just a few questions to consider.
3. Define the goals of the organization.
Consider what long-term business goals your organization wants to achieve. You may look at your mission, vision, and values to define these. Or you may interview executive and department leaders to understand what they are trying to measure, what they are trying to improve, and what questions they are trying to answer.
4. Determine how data and analytics will impact those goals.
You have to understand where your organization is today, where it wants to go, and how data analytics can help it get there. For example, let’s say you have a website and mobile app but you want to increase traffic/activity on both. That means you’ll need to collect behavioral data on your website visitors and app users. You also may need to collect their feedback via surveys or interviews to better understand not only what they do but why they do it.
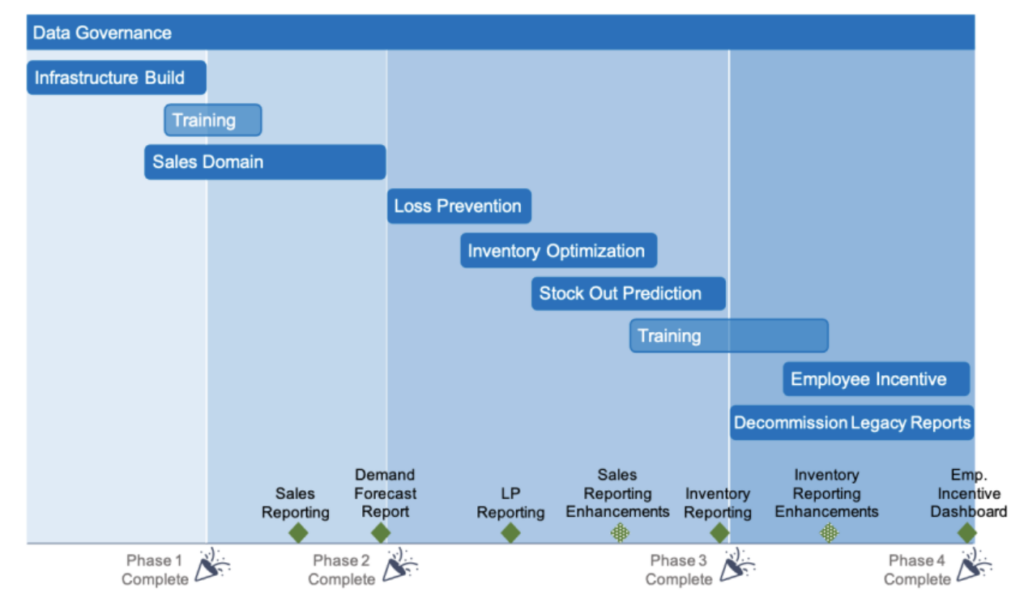
5. Build a strategic roadmap to realize those goals.
At this stage, you want to lay out how you’re going to achieve the goal outlined earlier. This roadmap may involve adding data analytics tools to your tech stack, hiring additional data analysts or data analyst consultants, and providing data and analytics training to employees in particular business units. Each part of the roadmap should have an estimated timeline and budget.
Here’s an example of a strategic roadmap divided into four phases:
6. Implement that roadmap.
Start executing on the different parts of the roadmap. That may mean launching new data analytics projects, programs, products, or infrastructure.
For example, you may kick off your new data analytics strategy by creating predictive models to identify possible channel partners based on their access to customers who are most likely to buy your products. You can then use anomaly detection algorithms to compare the channel partner’s performance against regional and industry benchmarks to ensure they’re performing up to standard. This is just one example of how data analytics can be used to optimize your sales strategy.
7. Track your progress.
Each strategic initiative that’s part of your roadmap should have a desired outcome. These should be documented before the initiative is launched to ensure that the most impactful initiatives are prioritized.
Once launched, use key performance indicators or objectives and key results to track the progress of each initiative. You may identify areas of improvement that can help you ultimately achieve your business goals.
8. Share the results with leadership and other stakeholders to get buy-in.
It can be difficult — and at times costly — to implement a data analytics strategy and all the data-driven initiatives it consists of. But this strategy can help solve the most important problems facing your organization.
It’s essential that you share the results of your strategic initiatives with executives and other key stakeholders so they understand what data can do to advance your organizational goals. This will help demonstrate value and build momentum.
9. Optimize the strategy.
The final step is to iterate on the strategy. Creating a data strategy is not a one-and-done activity. It’s important that you periodically review the strategy and update it based on changes in business objectives, employees, tools, and other factors. You should establish a policy — and assign policy owners — for monitoring your strategy and adapting it as needed.
Leveraging the Power of Data Analytics
Data analytics has the potential to transform businesses today. It can improve strategic and operational decision making and uncover new questions and new ways of doing business that leaders may not have even considered. The key is to invest in the people, tools, and infrastructure needed to create and execute an organizational data strategy roadmap.